LC-MS and HPLC-UV for Detecting Uremic Toxins: Two Validated Methods with Simultaneous Sensitivity and Specificity Evaluation

LC-MS and HPLC-UV: Advancing Uremic Toxin Detection with Precision

Uremic toxins (UTs), such as Indoxyl Sulfate (IS) and p-Cresyl Sulfate (PCS), are metabolic byproducts that accumulate in patients with chronic kidney disease (CKD). These toxins are indicators of renal dysfunction and contribute to the progression of CKD and associated complications. A recent study presents two validated analytical methods—LC-MS/MS and HPLC-UV—for simultaneously detecting free and protein-bound UTs with high sensitivity and specificity.

Key Highlights of the Study

  1. Toxins Monitored:
    • Indoxyl Sulfate (IS): Derived from tryptophan metabolism, IS accumulates due to impaired renal excretion, exacerbating CKD progression.
    • p-Cresyl Sulfate (PCS): Produced from phenylalanine metabolism, PCS contributes to inflammation and tubular cell damage.
  1. Methods Validated:
    • LC-MS/MS:
      • Utilizes negative Electrospray Ionization (ESI) mode for detecting free UTs.
      • Achieves precise quantification with mass/charge transitions specific to IS and PCS.
    • HPLC-UV:
      • Separates and detects protein-bound UTs at a wavelength of 200 nm.
      • Employs a polar C18 column for enhanced separation of toxins and proteins.
  1. Advantages:
    • Simultaneous detection of free and protein-bound toxins.
    • Cost-effective, robust, and reproducible methods.
    • Reduced variability compared to traditional techniques.

Clinical Relevance

The proposed methods provide reliable tools for monitoring UTs in CKD patients. Early and accurate detection supports personalized treatment approaches, such as dialysis optimization or timely transplantation. Additionally, these methods facilitate research on UTs’ roles in CKD progression and related systemic conditions.

For an in-depth understanding, explore the complete study here or via the DOI link.

Tags:

  • Chronic Kidney Disease
  • Uremic Toxins
  • Indoxyl Sulfate
  • p-Cresyl Sulfate
  • Analytical Chemistry
  • LC-MS/MS
  • HPLC-UV

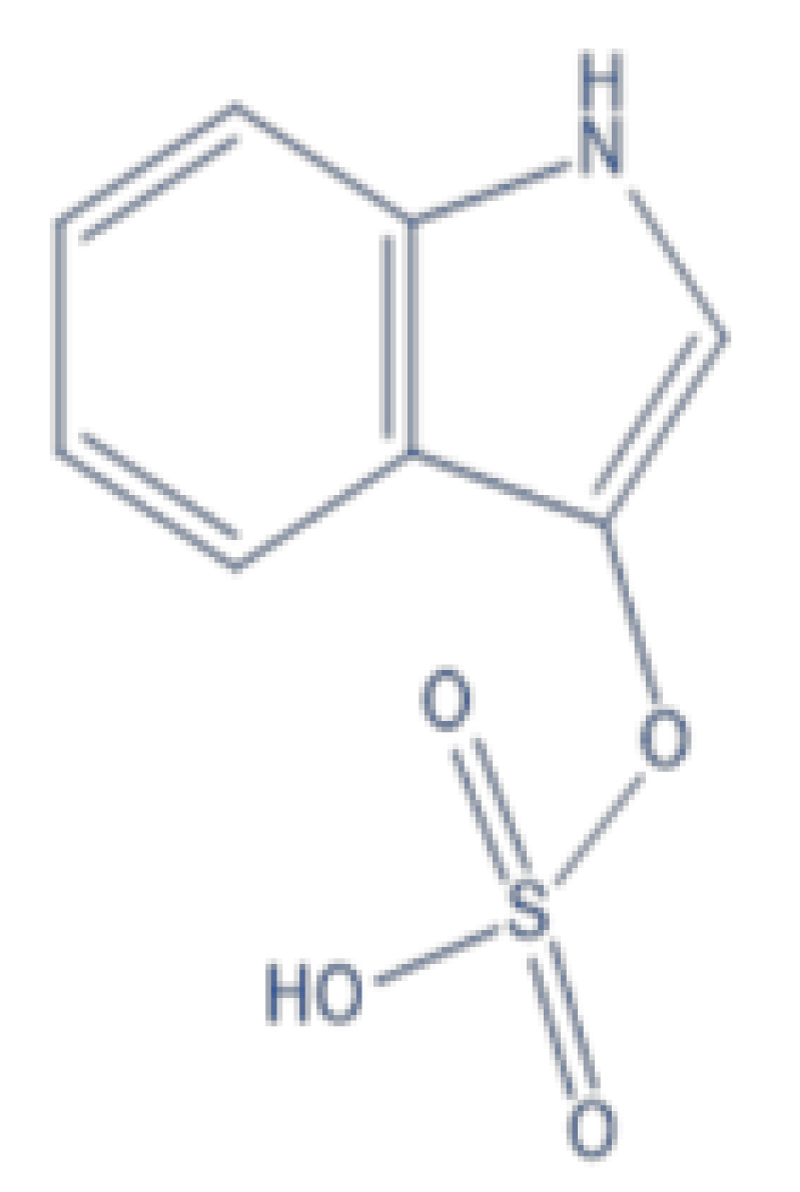
Figure 1: Chemical Structure of Indossyl Sulphate.

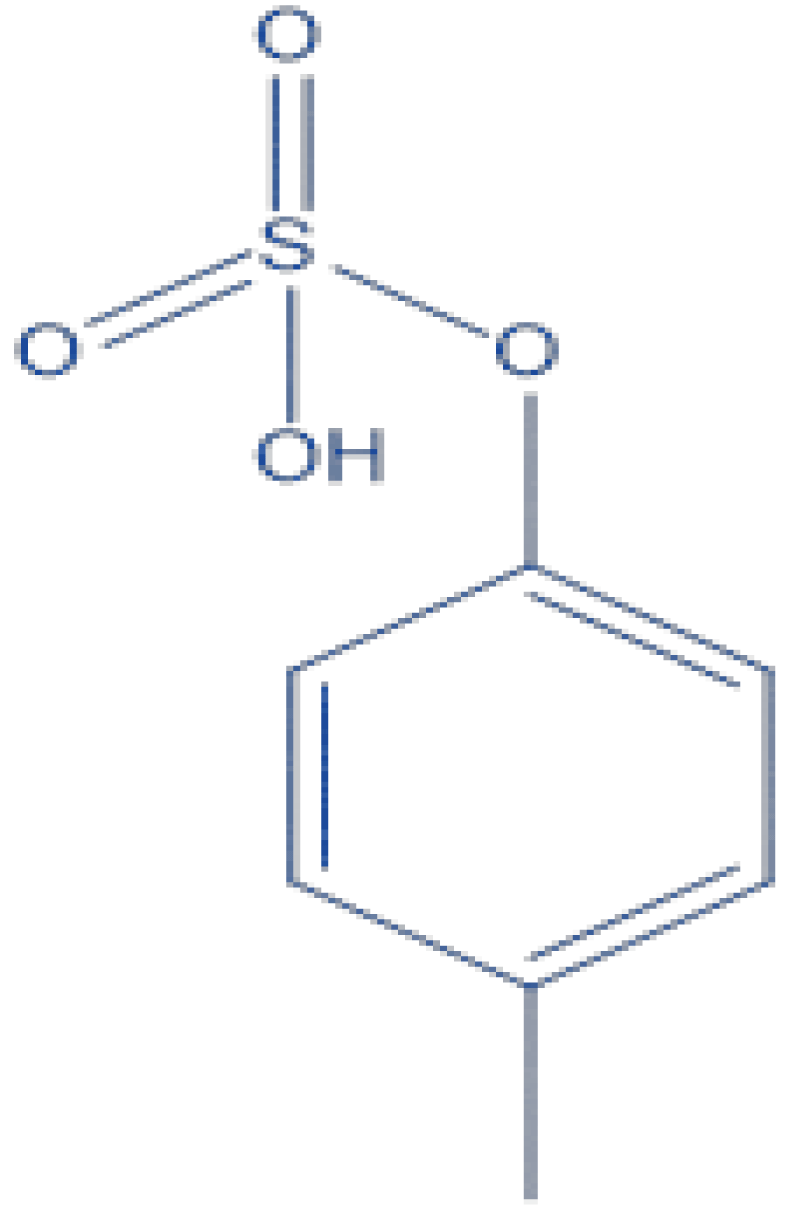
Figure 2: Chemical Structure of P Cresyl Sulphate.

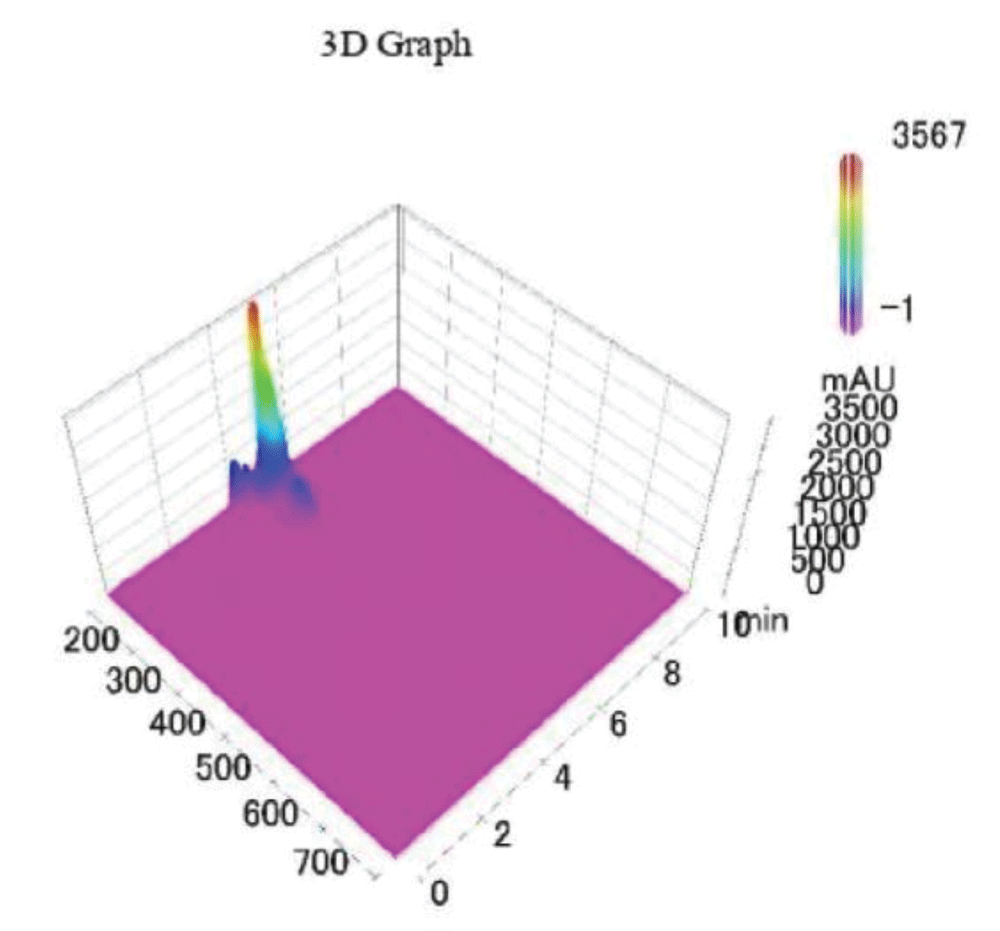
Figure 3: 3D graph of a standard sample of PCS-IS analysed via HPLC-UV.

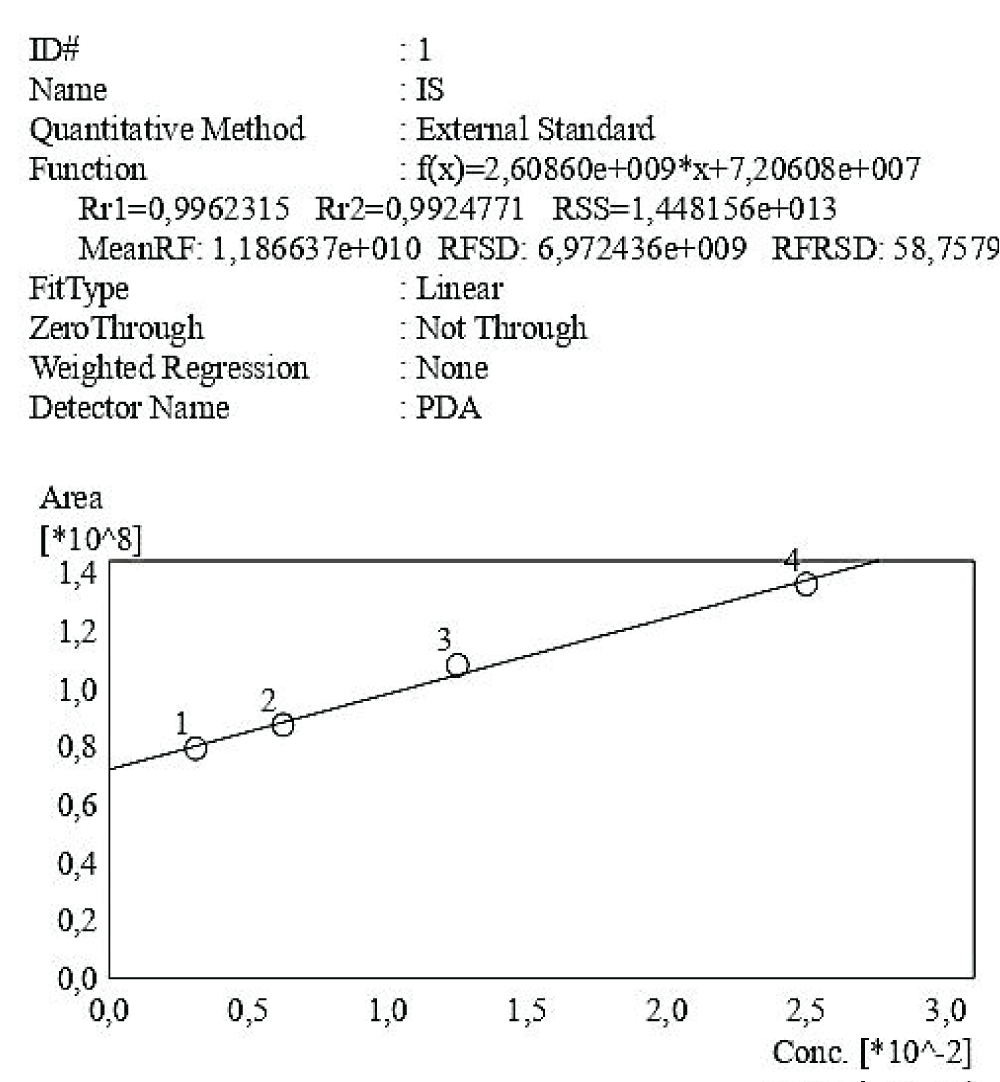
Figure 4: Calibration curve of Indossyl Sulphate obtained via HPLC-UV at 200 nm. The picture also reports the equation of the calibration curve as well as the correlation coefficient R2. The curve was created using the Quant Browser on the LabSolutions WS-Single PDA Software.

Leave a Reply

Your email address will not be published. Required fields are marked *