AFM Analysis of Polymeric Membranes Fouling

Understanding and Tackling Membrane Fouling in Wastewater Treatment

Membrane technology has revolutionized wastewater treatment, offering a sustainable approach to water purification. However, fouling—an unavoidable challenge—remains a major obstacle in optimizing membrane performance. Recent research, “AFM Analysis of Polymeric Membranes Fouling” (DOI), sheds light on fouling mechanisms and potential solutions through atomic force microscopy (AFM) analysis.

The Role of Membranes in Wastewater Treatment

Membranes, particularly those made of polyvinylidene fluoride (PVDF) and polysulfone (PS), are essential for industrial and municipal wastewater treatment. These membranes separate contaminants based on pore size and surface characteristics, making them vital for recovering clean water and valuable dissolved compounds.

Membrane Types Studied:

  • PVDF with pore sizes of 0.2 mm and 0.5 mm.
  • PS with a pore size of 0.2 mm.

These materials were evaluated under static conditions to understand fouling behavior when exposed to industrial wastewater (IWW).

What is Fouling?

Fouling occurs when particulates, macromolecules, and organic substances accumulate on a membrane’s surface or inside its pores. It leads to:

  • Reduced water flow (flux).
  • Increased operational costs due to cleaning or replacement.

Types of Fouling:

  1. Pore Blocking: Small particles obstruct pores, decreasing filtration efficiency.
  2. Cake Formation: A layer of fouling material builds up on the membrane surface over time.

Image: Visualization of fouling mechanisms on polymeric membranes.

Atomic Force Microscopy (AFM) Insights

AFM analysis was used to examine the surface morphology and roughness of membranes before and after exposure to wastewater. Key findings include:

Roughness Trends

  • PVDF 0.2 mm: Exhibited the highest roughness and fouling after immersion.
  • PVDF 0.5 mm: Showed lower roughness, correlating with better antifouling performance.
  • PS 0.2 mm: Moderate roughness and fouling compared to PVDF membranes.

Time-Based Fouling Analysis

  • Roughness increased significantly during the first 120 minutes of immersion.
  • After four hours, roughness stabilized, but fouling persisted due to cake formation.

Key Findings

  1. Pore Size and Material Matter
    Larger pores (e.g., PVDF 0.5 mm) resisted fouling better than smaller pores, as fouling material often matched or exceeded pore size.
  2. Surface Chemistry Impacts Fouling
    Hydrophilic membranes (PS) showed reduced fouling compared to hydrophobic PVDF membranes.
  3. Cleaning Potential
    Preliminary results suggest that membranes can be cleaned effectively, restoring initial performance, which is critical for cost-effectiveness.

Strategies to Combat Fouling

1. Surface Modifications

  • Enhancing hydrophilicity through chemical treatments can minimize fouling.
  • Reducing surface roughness prevents particles from adhering to membranes.

2. Optimal Operating Conditions

  • Adjusting pH, pressure, and flow rate can mitigate fouling during operation.

3. Membrane Selection

  • Using larger pore sizes and hydrophilic materials for specific applications improves durability and performance.

Applications and Implications

Environmental Impact

By improving fouling resistance, membrane technology can:

  • Reduce industrial waste.
  • Enhance water recovery and recycling.

Economic Benefits

Durable, easy-to-clean membranes lower maintenance costs and extend operational lifespan.

Conclusion

Understanding fouling mechanisms through AFM analysis provides a roadmap for designing more efficient and sustainable membranes. By addressing surface roughness, pore size, and material properties, wastewater treatment can become more reliable and cost-effective. This research marks a significant step forward in tackling one of the most persistent challenges in water purification.

Tags

  • Membrane Technology
  • Wastewater Treatment
  • Membrane Fouling
  • Atomic Force Microscopy
  • PVDF Membranes
  • Industrial Water Purification
  • Environmental Sustainability
  • Water Recycling

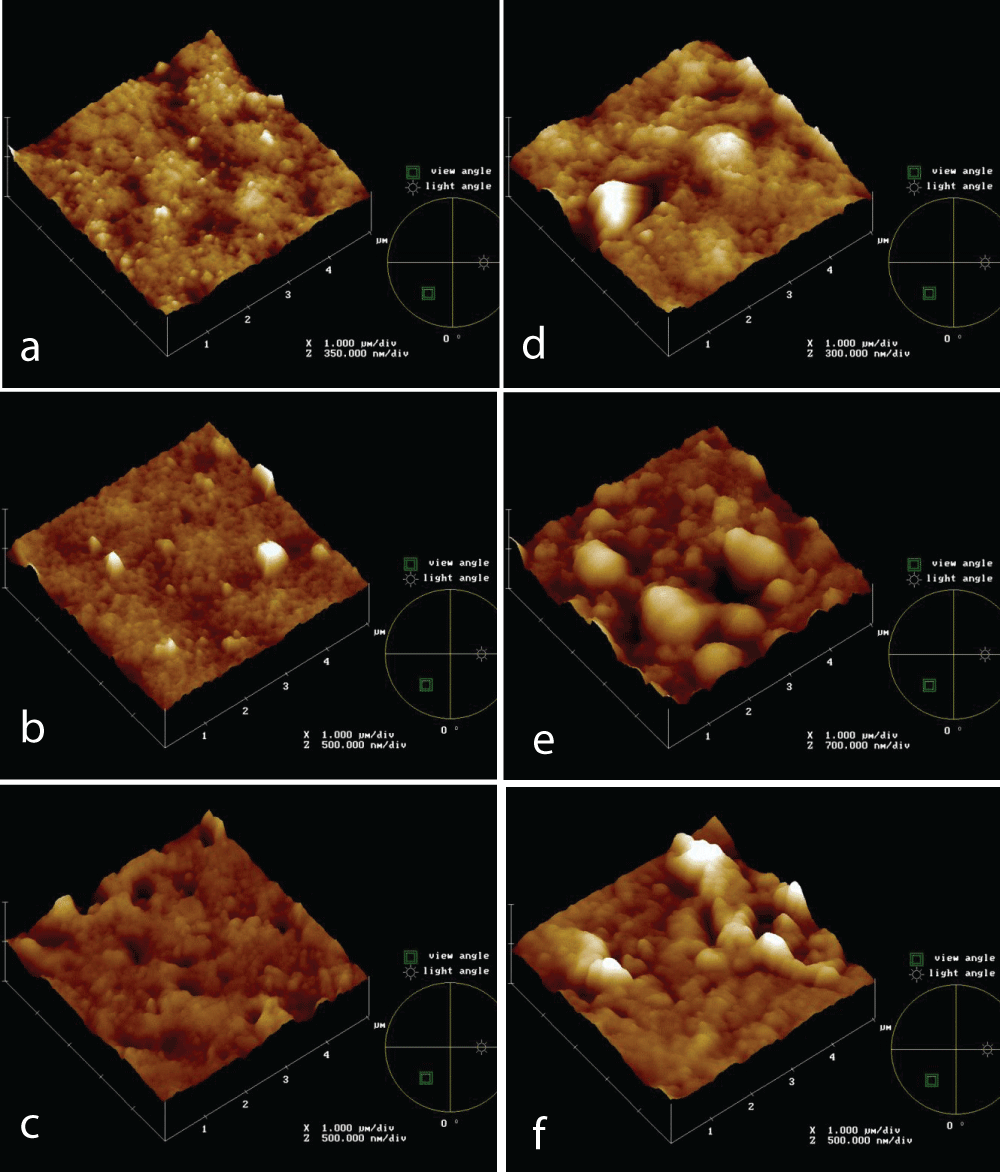
Figure 1: AFM topographies of new and after 4h in the IWW beaker PVDF 0.5 mm (a, d, respectively), PVDF 0.2 mm (b, d, respectively), PS 0.2 mm (c, f, respectively) membranes.

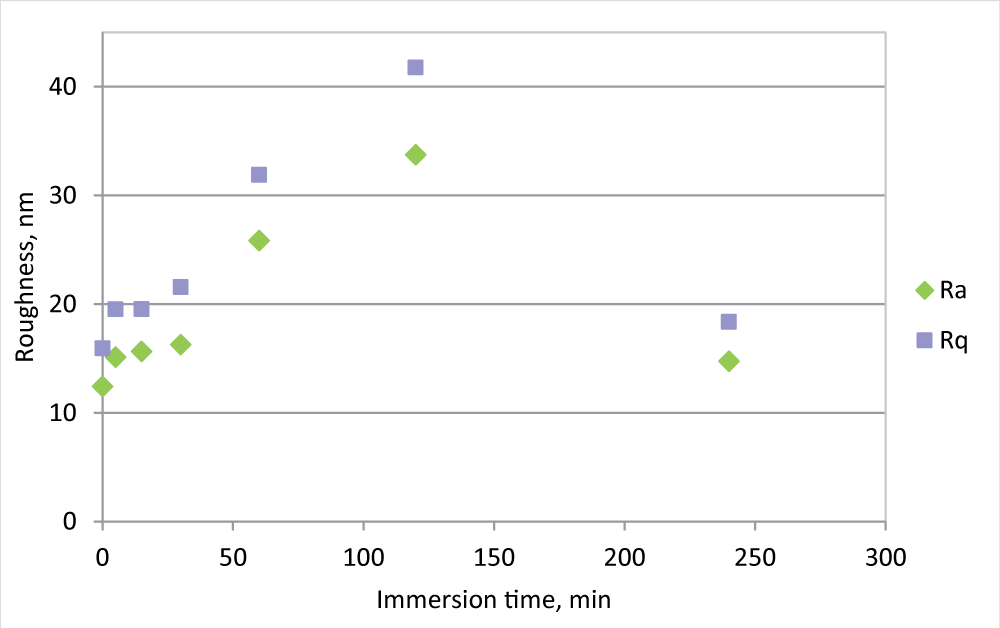
Figure 2: Ra and Rq measurement for PVDF 0.5 mm membrane, new and in the IWW beaker for different times.

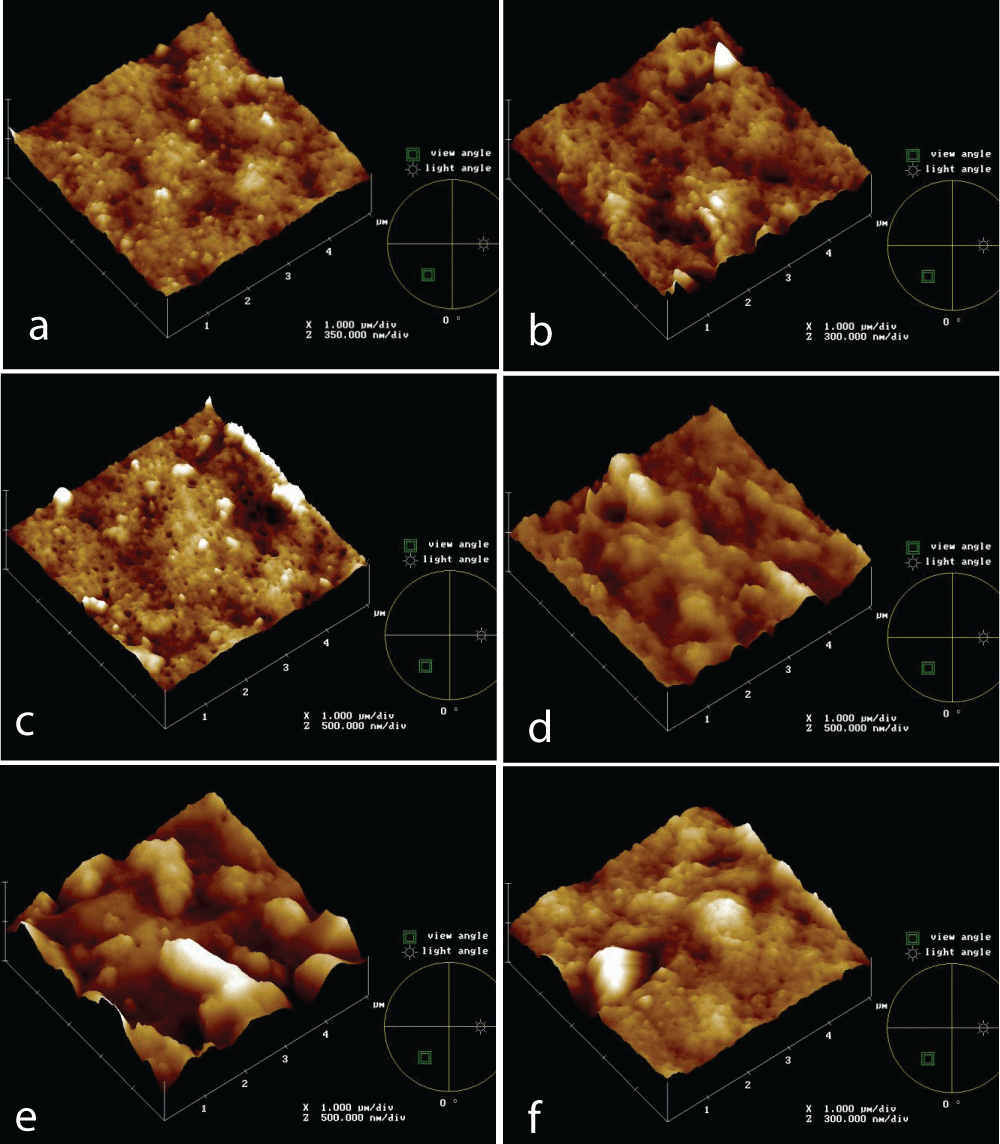
Figure 3: AFM topographies of PVDF 0.5 mm membrane new (a) and at different times of IWW beaker immersion test: 5’ (b), 30’ (c), 60’ (d), 2h (e), 4h (f).

Leave a Reply

Your email address will not be published. Required fields are marked *